Case Study 1 · ERP correlates of neuropsychological performance
A hypothesis-driven look at whether two classic ERP components — N400 and P300 — relate to neuropsychological performance in post-stroke patients, using four scalar features and linear regression.
Research question
Are the amplitude and latency of specific ERP components associated with neuropsychological performance and demographic characteristics in post-stroke patients?
This is a hypothesis-driven question: rather than exploring the full spectral or spatiotemporal structure of the EEG signal (see Case Study 2), it targets two specific, well-characterised ERP components:
- N400 — a negative deflection ~400 ms post-stimulus, indexing semantic processing and language comprehension (Kutas & Federmeier, 2011)
- P300 — a positive deflection ~300 ms post-target, indexing attentional resource allocation (Polich, 2007)
For each component we consider amplitude (mean µV in a predefined window) and latency (ms of peak amplitude) — four participant-level neural predictors in total.
Data
The code uses a synthetic (mock) dataset of 40 simulated post-stroke patients, so it can be run end to end without access to real clinical data:
dataset_NPSY.csv— demographics (age, sex) and neuropsychological scores (CRIq, APACS, Attentive Matrices, MoCA)dataset_ERP.csv— the four ERP features (N400/P300 amplitude and latency), linked bysubject_id
Pipeline
1. Data Wrangling
- Load & merge
- Range & missing-data checks
- Normality & outlier detection
2. Analysis
- Descriptive statistics
- Bivariate correlations
- Three regression models (APACS; Attentive Matrices, kitchen-sink vs. theory-guided)
- Post-hoc diagnostics (Q-Q, Cook's distance, VIF)
3. Export
- Figures (PNG)
- Tables (CSV + Excel)
- Ready to reuse in a report or a slide
A taste of the results
-
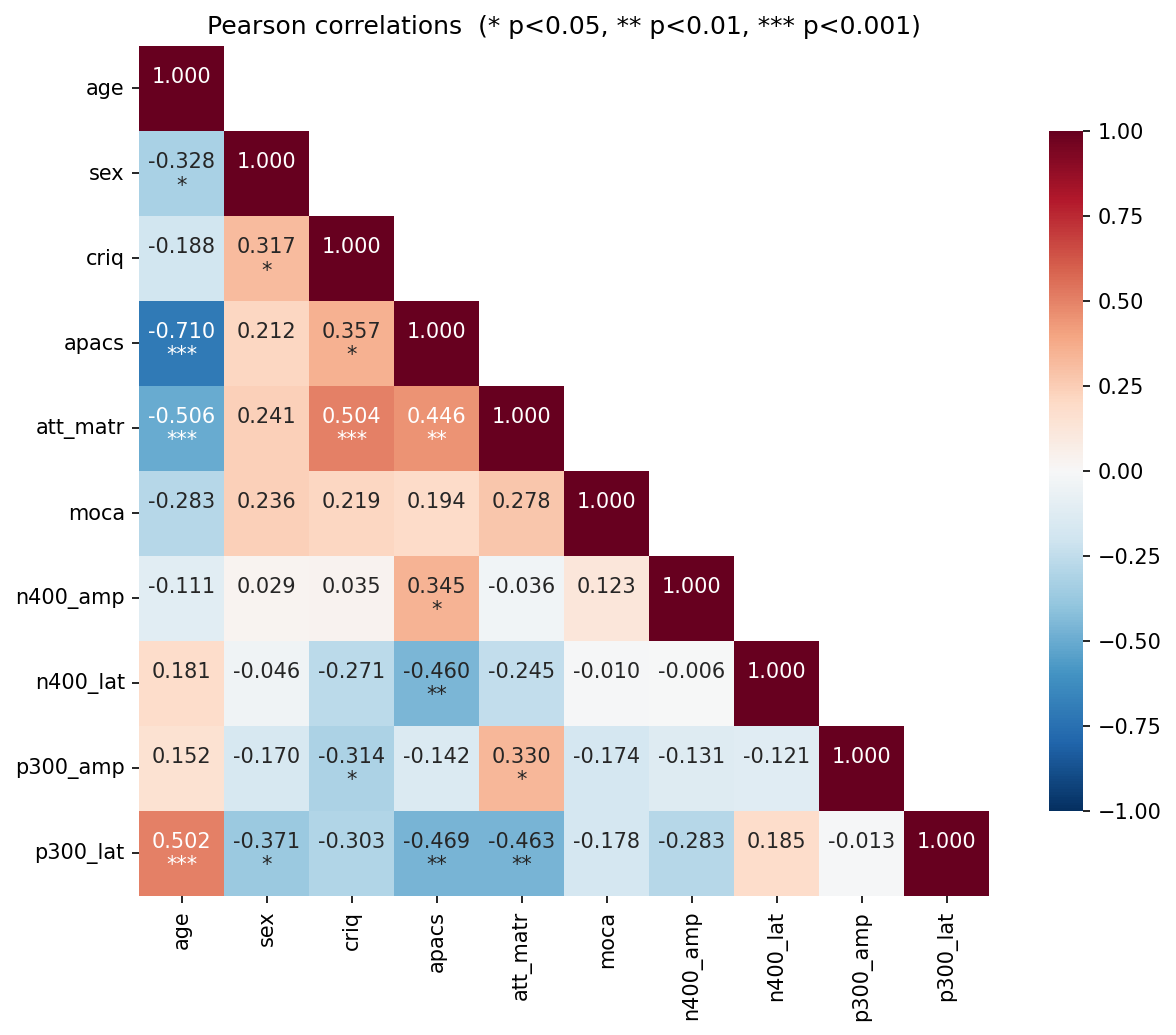
Pearson correlations between all ERP and neuropsychological variables, annotated with significance stars.
-
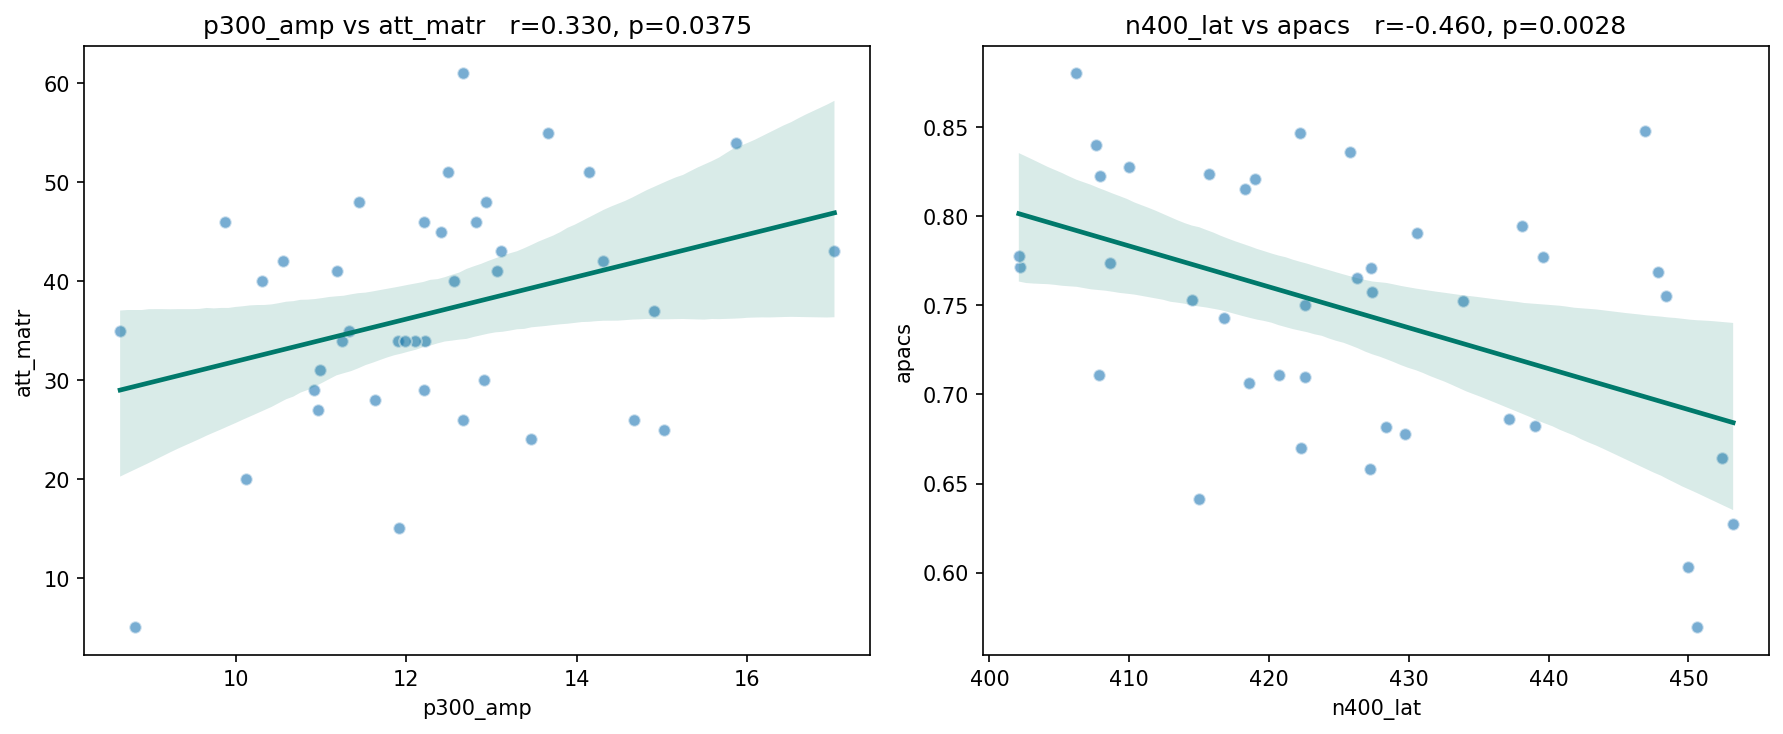
The two hypothesised associations (P300 amplitude ↔ Attentive Matrices; N400 latency ↔ APACS), with regression line and 95% CI band.
Key takeaway
More predictors do not make a better model — and how you decide which ones to drop matters as much as the decision itself. Choosing predictors a priori, from theory, avoids the circular reasoning of dropping whatever happens to be non-significant in a bigger model. See the full reasoning in the code, Section 2.3.
Strengths and limitations
Strengths — reduces high-dimensional EEG to four interpretable scalar features; uses regression models that are familiar to clinical researchers; N400 and P300 rest on decades of validation in neurological populations.
Limitations — the predefined time windows and electrode sets may miss effects that are delayed, spatially atypical, or otherwise deviate from the normative pattern the features were designed to capture — a particular risk in a clinical population such as stroke patients. When the question is broader or more exploratory, see Case Study 2.